






Quantitative Intuition for CFOs
The Judgement Layer Beneath the Numbers
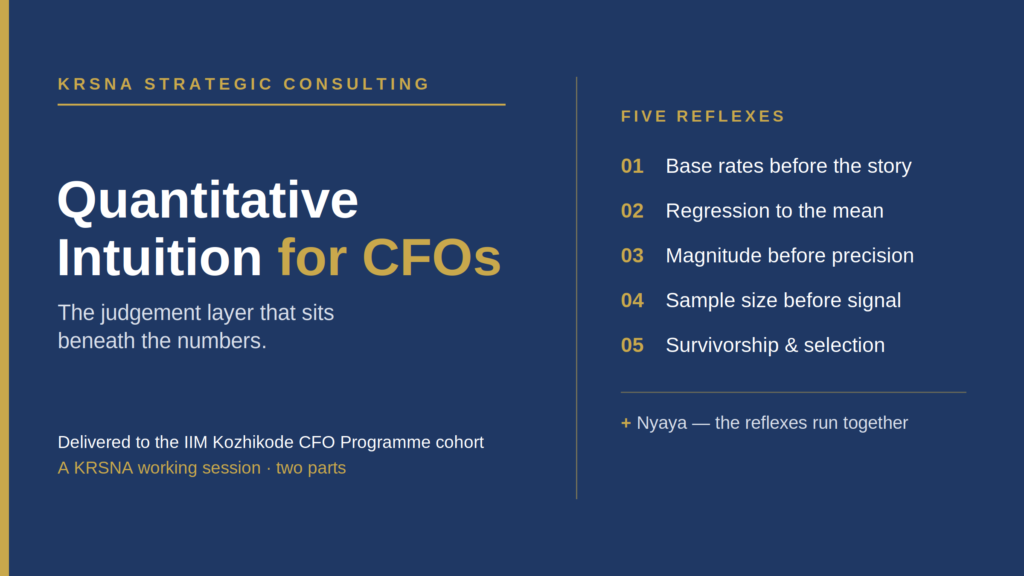
Reflections from a two-part working session delivered to my IIM Kozhikode CFO Programme cohort.
I was recently invited by fellow members of my IIM Kozhikode CFO Programme cohort to lead a two-part working session on a subject I have circled for most of my career: the judgement that sits underneath financial numbers. To be precise about it — this was a peer invitation from within the cohort, not an engagement of IIM Kozhikode as an institution. That distinction matters to me, and it set exactly the right tone: a room of practising finance leaders, examining how they actually read numbers under pressure.
The encouraging part is that this judgement is not advanced statistics. It comes down to five or six habits of mind, each a defence against a specific cognitive trap. Once named, they can be trained and applied to almost any number that crosses your desk. We worked through five:
• Base rates before the story.
The outside view before the inside view. A founder’s confident 70% forecast is a story; the reference-class frequency is the discipline. The honest number lives closer to the base rate.
• Regression to the mean.
Every extreme result is part skill and part luck, and luck does not persist. A region that beats target by 42% is unlikely to repeat it — not because anyone failed, but because that is what statistics does.
• Magnitude before precision.
A precisely wrong number is more dangerous than an imprecisely right one, because the precision invites false confidence. A lost decimal in a currency conversion once turned ₹14.77 Cr of EBITDA into a reported ₹147.74 Cr. The source was attested; the transformation layer was not.
• Sample size before signal.
A trend drawn from a handful of observations is a hypothesis, not a finding. If you cannot construct an honest confidence interval around the claim, you have an anecdote.
• Survivorship and selection.
Always ask what population is missing from the dataset, and whether including it would change the conclusion. The premium tier did not cause lower churn; it selected for customers who were already going to stay.
From there we moved through the shapes that distort financial reasoning — why so much of business reality is log-normal rather than the bell curve everyone quietly assumes, and why reporting a mean when the median is the honest number quietly misleads the room. We looked at why long-horizon forecasts decay far faster than people expect, and at how fragile an NPV verdict becomes once you admit that the discount rate itself carries real uncertainty.
The session closed on Nyaya (न्याय) — valid reasoning, impartial judgement — a KRSNA decision instrument that runs four of these reflexes together on the same data. The point was not the tool. The point was what the reflexes look like when they are no longer separable: the same project that reads “borderline approve” as a single-point NPV carries a 44% probability of a negative outcome once you look at the distribution. Both readings are honest. The first reflex was applied; the fourth was not.
I left the cohort with five questions to carry into any room, whatever the number on the table:
1. What is the reference class, and what is its base rate?
2. What is the distribution shape, and does the mean honestly represent the typical outcome?
3. Is this correlation, or a causal mechanism I can name and defend?
4. What is the range of outcomes — where do the tails sit — rather than the point estimate?
5. Does the magnitude justify the decision, or am I being shown statistical significance in place of economic significance?
This is the discipline that runs through KRSNA’s advisory work with unlisted manufacturing, engineering, and chemicals enterprises: read the unstated assumption first, then read the output. The numbers are never the hard part. Knowing how much to trust them is.